


Observability for managed cloud and AI systems.

KineticSkunk helps teams design, instrument, and operate observability across AWS platforms and AI workloads so systems remain measurable, traceable, and explainable under pressure.

Take the assessment

View observability insights

Datadog logo

Datadog partner proof you can verify for observability platforms

Datadog partner listing supports vendor review for observability tooling. The real value comes from how observability connects infrastructure, applications, and AI systems into a single operational view.

Datadog observability platform

Unified platform covering metrics, logs, traces, and AI workloads.

Teams gain visibility across infrastructure, applications, and model-driven systems in one place.

Observability in managed platforms

Observability only works when it reflects how systems are actually built and operated.

Monitoring becomes part of platform design, not an afterthought added after incidents.

AI observability readiness

AI systems introduce new requirements around traceability, cost visibility, and response explainability.

Teams can understand model behaviour, investigate incidents, and support audit requirements.

How Datadog supports managed cloud and AI systems

Datadog becomes the observability layer when AWS platforms and AI systems need behaviour to stay visible, traceable, and explainable.

Unified visibility

Infrastructure, applications, and AI workflows are observed in one system.

Traceable behaviour

Requests, services, and model interactions can be followed end to end.

Operational clarity

Metrics, logs, traces, and events remain available for incident response and review.

Below is how each observability service lane strengthens that operational view.

Datadog Observability Services We Support

Expand each lane to see how observability supports managed AWS platforms and AI workloads.

Datadog serviceCloud observability foundation
AWS platforms are monitored through metrics, logs, traces, and service-level visibility.

Observability starts with infrastructure and application visibility.

We design telemetry pipelines so system behaviour is measurable before incidents occur.

Part of the AWS Managed Platform

This is the foundation for managed platforms where uptime and performance must be understood in real time.

  • Metrics, logs, and traces aligned to platform architecture
  • Service-level monitoring across workloads
  • Alerting aligned to operational priorities
Datadog serviceAI observability
AI systems become traceable, measurable, and explainable in production.

AI systems introduce uncertainty that traditional monitoring cannot explain.

We instrument LLM workflows so prompts, responses, latency, and cost become visible.

Part of the AWS Managed Platform

This is the observability layer for teams running AI systems that need to be debugged and trusted.

  • Prompt and response tracing
  • Latency and failure visibility
  • Token usage and cost monitoring
Datadog serviceIncident visibility
Teams can detect, investigate, and respond to incidents with clear system insight.

Incidents are harder to resolve when systems are distributed and event-driven.

We align observability signals so failures can be traced and understood quickly.

Part of the AWS Managed Platform

This is the operational path for teams that need to reduce time to detection and resolution.

  • Correlated logs, metrics, and traces
  • Root cause visibility
  • Alerting aligned to impact
Datadog serviceCost visibility
Platform and AI costs become visible at workload and request level.

Cloud and AI costs are difficult to control without visibility.

We connect usage signals to system behaviour so cost decisions become informed.

Part of the AWS Managed Platform

This is the visibility layer for teams managing cloud and AI spend.

  • Token and API usage visibility
  • Cost per workload or service
  • Usage patterns tied to system activity
Datadog serviceObservability governance
Systems produce evidence that supports audit, compliance, and review.

Observability is increasingly part of audit and compliance requirements.

We ensure logs, traces, and system activity can support investigation and reporting.

Part of the AWS Managed Platform

This is the governance layer for teams that need to explain system behaviour under review.

  • Traceable system activity
  • Historical visibility for investigation
  • Evidence supporting audit processes

How we make observability useful

Observability starts with the current system and moves toward a platform that supports operations, incidents, and AI workloads.

Existing platform

Already running systems? Improve visibility.

We review services, telemetry, logs, traces, metrics, alerts, dashboards, ownership, and investigation paths before changing what teams already rely on.

  1. 1

    Observability estate assessment

    Map services, infrastructure, telemetry sources, dashboards, alerts, ownership, and current investigation workflows.

    Known visibility surface

  2. 2

    Signal and gap review

    Separate useful signals from noise, identify blind spots, and prioritise the telemetry needed for managed operations.

    Prioritised visibility plan

  3. 3

    Instrumentation alignment

    Align metrics, logs, traces, service naming, tags, and telemetry standards to the way the platform is operated.

    Consistent telemetry model

  4. 4

    Dashboard and alert design

    Create dashboards and alerts that reflect service impact, operational priority, and realistic response paths.

    Actionable operational view

  5. 5

    Managed platform handover

    Document monitoring routines, alert ownership, investigation paths, and support expectations for ongoing operations.

    Operable observability model
New managed platform

Building new systems? Design observability from the start.

We design observability alongside the cloud or AI platform so metrics, logs, traces, dashboards, alerts, and evidence are planned before production pressure lands.

  1. 1

    Observability architecture design

    Define telemetry architecture, service boundaries, tagging, data retention, dashboard patterns, and integration points.

    Clear visibility design

  2. 2

    Telemetry standards

    Create repeatable standards for metrics, logs, traces, naming, ownership, and service-level indicators.

    Reusable observability foundation

  3. 3

    Platform integration

    Connect infrastructure, applications, managed services, and AI workflows into the observability layer.

    Connected operational signals

  4. 4

    Alerting and dashboards

    Design dashboards and alert routes around customer impact, operational ownership, and support routines.

    Ready operational view

  5. 5

    Operational readiness

    Hand over investigation paths, dashboard usage, alert response, and support routines into the platform operating model.

    Managed observability

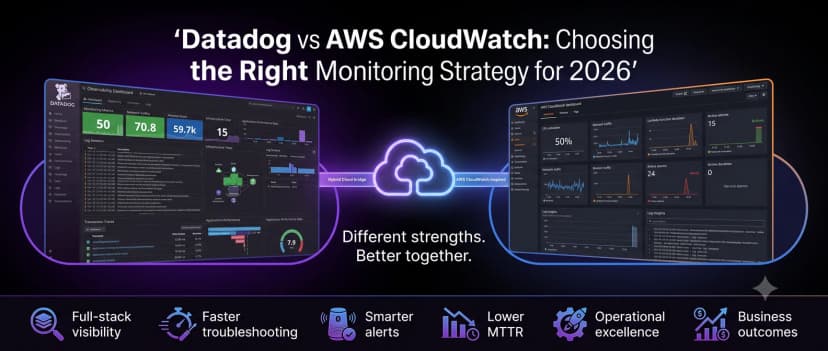
Read the Datadog vs CloudWatch comparison

Datadog vs AWS CloudWatch: Choosing the Right Cloud Monitoring Strategy for 2026

A practical hybrid model for AWS-native monitoring and enterprise observability

Choosing the Right Cloud Monitoring Strategy

Compare Datadog and AWS-native observability options for managed cloud and AI platforms. This article maps where CloudWatch is enough, where Datadog adds correlation value, and how South African teams can tier monitoring cost and incident response.

  • Compare CloudWatch, Datadog, Grafana, and Prometheus for AWS workloads
  • See where AWS-native monitoring is enough and where Datadog adds correlation value
  • Use a tiered hybrid model for cost, incidents, and South African team constraints
  • Link observability choices to assessment, partner delivery, and proof

Observability and AI insights

These insights connect observability to cloud platforms, incident response, and AI systems.

Make your systems easier to understand.

If your cloud platforms or AI systems are becoming more important, your observability needs to show what is happening, why it happened, and how to respond.

Back to partners